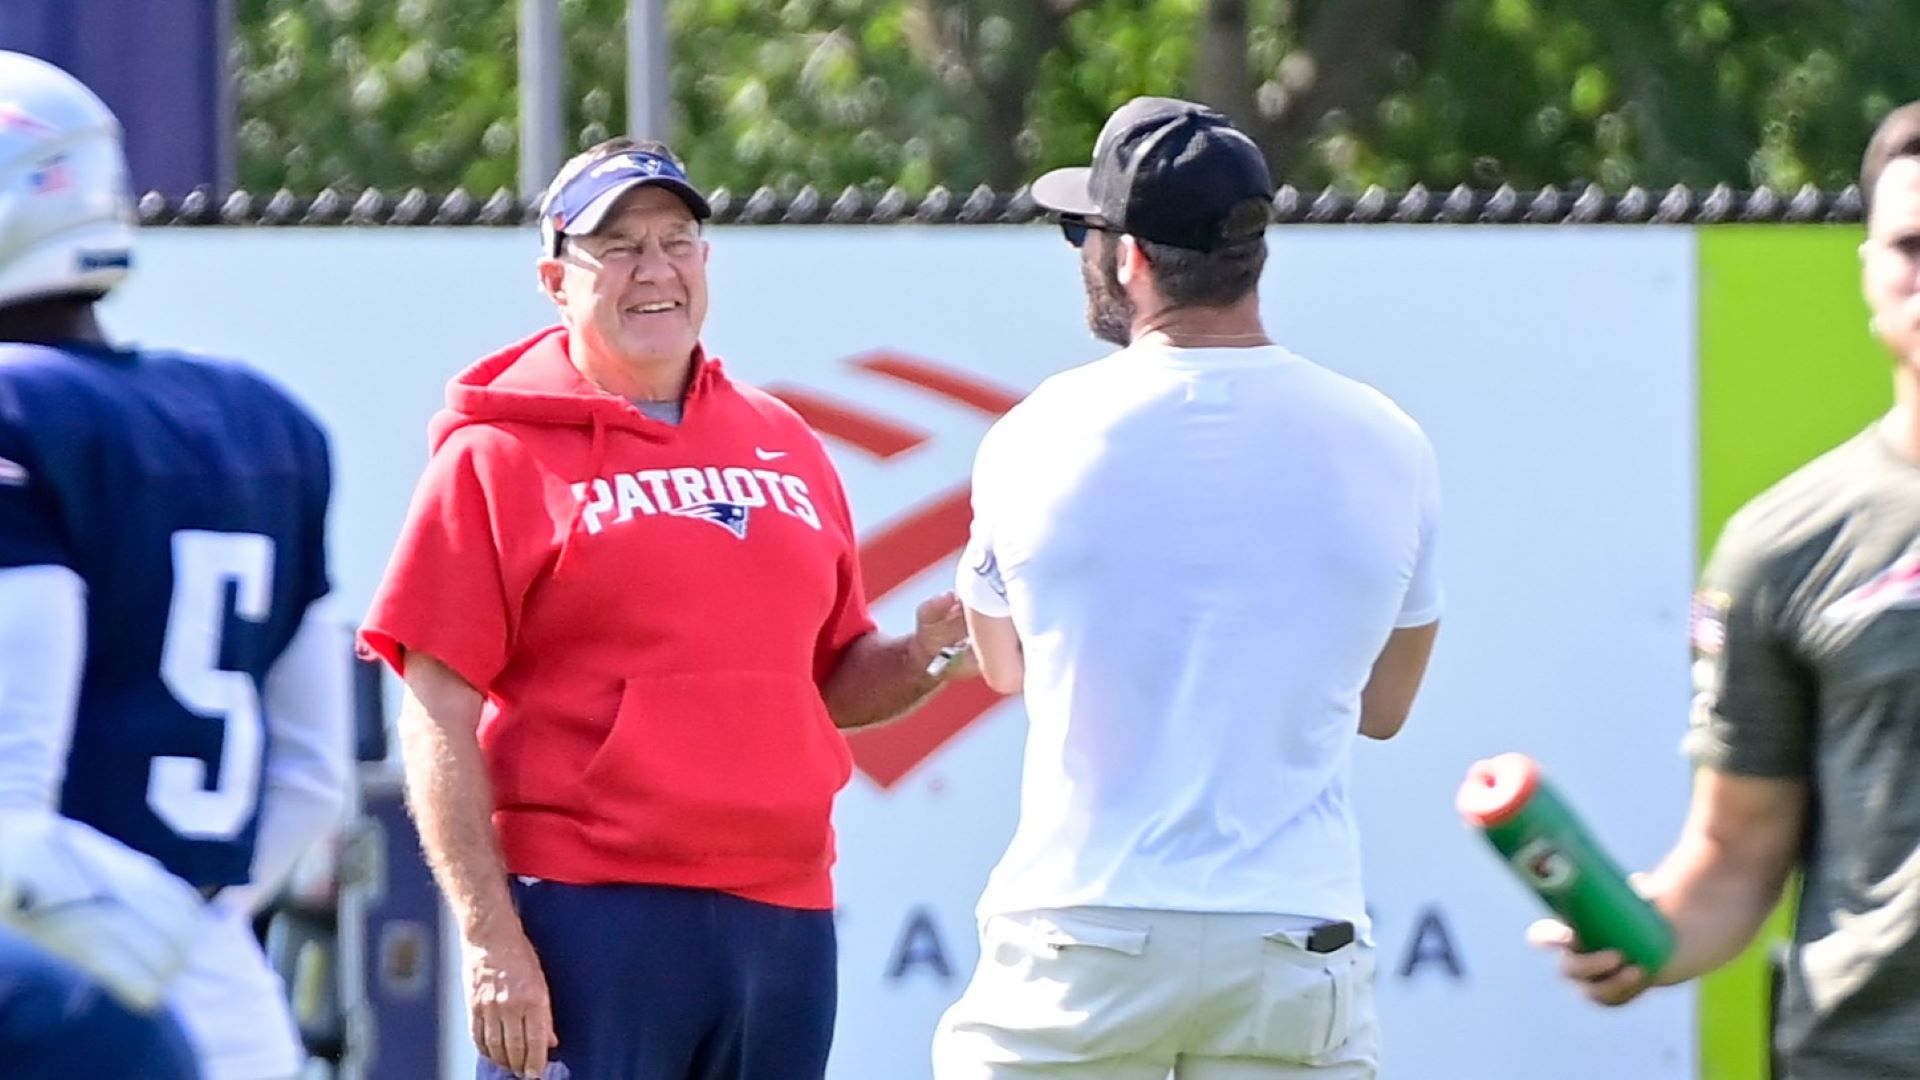
There's a recent perception that Bill Belichick and the New England Patriots are constantly whiffing in the NFL draft like they're walking up to the plate playing dizzy bat.
And it must be recent because Belichick is the same person who brought quarterback Tom Brady, defensive lineman Richard Seymour and tight end Rob Gronkowski, among a slew of other talented players to New England over the last 21 years.
But the Patriots' drop off from going 12-4 and winning the AFC East in 2019 to finishing 7-9 and out of the postseason a year later is commonly blamed on Belichick's draft misses.
So, is it true, and is that fair? Has Belichick lost the ability to find talented players through the cheapest and most efficient means to build a team? Or is it all a bunch of nonsense?
I did the research so you don't have to.
Here's a glossary of stats I devised to determine how much value teams are extracting specifically from the draft using Pro Football Focus' Approximate Value, or AV, metric:
Value Rate: Team or player AV divided by total draft class AV
This is percent of value teams are drawing out of the draft.
Value Rate+: Value Rate where average=100
This is a simpler way of looking at Value Rate. Think of it like ERA+ or OPS+ if you're a baseball fan.
Value Vs. Expected rate: How a player's Value Rate compares to the expected Value Rate from his draft slot
This is a gauge of how efficiently teams are using their draft picks.
AV is not a perfect stat. But it is the best, easiest and most uniform metric to use for a broad exercise like this one.
2016-2020
The Patriots rank 26th in Value Rate and 24th in Value Vs. Expected Rate from 2016 to 2020. So, it's definitely true that Belichick's drafts in recent years have suffered from a lack of quality picks.
| Rk | Team | Value Rate | Value Rate+ | Rk | Avg. Value Vs. Expected |
|---|---|---|---|---|---|
| 1 | BAL | 4.65% | 148.8 | 2 | 0.09% |
| 2 | IND | 4.19% | 134.08 | 5 | 0.08% |
| 3 | MIA | 3.79% | 121.28 | 7 | 0.05% |
| 4 | CLE | 3.62% | 115.84 | 29 | -0.08% |
| 5 | BUF | 3.48% | 111.36 | 3 | 0.09% |
| 6 | SF | 3.45% | 110.4 | 16 | -0.01% |
| 7 | MIN | 3.40% | 108.8 | 11 | 0.02% |
| 8 | JAX | 3.38% | 108.16 | 17 | -0.01% |
| 9 | WFT | 3.32% | 106.24 | 12 | 0.02% |
| 10 | DAL | 3.27% | 104.64 | 8 | 0.04% |
| 10 | NYG | 3.27% | 104.64 | 18 | -0.02% |
| 12 | LAC | 3.24% | 103.68 | 10 | 0.03% |
| 13 | SEA | 3.22% | 103.04 | 19 | -0.02% |
| 14 | DEN | 3.14% | 100.48 | 26 | -0.03% |
| 15 | TB | 3.12% | 99.84 | 20 | -0.02% |
| 17 | NO | 3.11% | 99.52 | 1 | 0.12% |
| 17 | DET | 3.11% | 99.52 | 21 | -0.02% |
| 18 | KC | 3.08% | 98.56 | 4 | 0.09% |
| 19 | TEN | 3.05% | 97.6 | 22 | -0.02% |
| 20 | CHI | 3.03% | 96.96 | 6 | 0.06% |
| 20 | CIN | 3.03% | 96.96 | 28 | -0.06% |
| 22 | GB | 3.01% | 96.32 | 23 | -0.02% |
| 23 | CAR | 2.98% | 95.36 | 14 | 0.01% |
| 24 | ATL | 2.85% | 91.2 | 9 | 0.04% |
| 25 | PIT | 2.79% | 89.28 | 13 | 0.02% |
| 26 | NE | 2.65% | 84.8 | 24 | -0.02% |
| 26 | LV | 2.65% | 84.8 | 32 | -0.12% |
| 28 | LAR | 2.61% | 83.52 | 15 | 0.00% |
| 29 | HOU | 2.43% | 77.76 | 25 | -0.02% |
| 30 | NYJ | 2.42% | 77.44 | 30 | -0.10% |
| 31 | PHI | 2.41% | 77.12 | 27 | -0.03% |
| 32 | ARI | 2.24% | 71.68 | 31 | -0.10% |
Now, let's go year by year to see how the Patriots fared with each class.
2020
Check out Part 1 of this series to see a deep dive of charts and metrics from the 2020 NFL Draft:
To recap: The Patriots ranked 16th in Value Rate and 22nd in Value Vs. Expected rate one season into an average 2020 NFL Draft class.
2019
In 2019, Belichick uncharacteristically drafted a wide receiver, N'Keal Harry, in the first round for the first time since he became head coach and general manager of the Patriots in 2000. So far, it's not going especially well for Harry. The Patriots traded up to take cornerback Joejuan Williams in the second round, grabbed outside linebacker Chase Winovich, running back Damien Harris and offensive tackle Yodny Cajuste in the third round, guard Hjalte Froholdt and quarterback Jarrett Stidham in the fourth round, defensive tackle Byron Cowart and punter Jake Bailey in the fifth round and cornerback Ken Webster in the seventh round.
| Player | Value Rate | Value Rate+ | Value Vs. Expected |
|---|---|---|---|
| N'Keal Harry | 0.32% | 81.15 | -0.44% |
| Joejuan Williams | 0.16% | 40.58 | -0.49% |
| Chase Winovich | 0.80% | 202.88 | 0.31% |
| Damien Harris | 0.40% | 101.44 | -0.02% |
| Yodny Cajuste | 0.00% | 0.00 | -0.38% |
| Hjalte Froholdt | 0.00% | 0.00 | -0.31% |
| Jarrett Stidham | 0.08% | 20.29 | -0.20% |
| Byron Cowart | 0.64% | 162.30 | 0.41% |
| Jake Bailey | 0.40% | 101.44 | 0.18% |
| Ken Webster | 0.16% | 40.58 | 0.09% |
Bailey, a 2020 All-Pro and Pro Bowl selection, has been the Patriots' best find but that's not illustrated in his Value Rate simply because punters don't generate much value. Winovich, Harris and Cowart also have been above average draft picks. It hurts the Patriots that Cajuste, Froholdt, Stidham and Webster have barely played.
Harry (244th of 255 players) and Williams (248th) are two of the worst values vs. expectation in the 2019 NFL Draft class. Williams is the worst value among second-round picks. Harry is the fifth-worst value among first-round picks.
Still, the Patriots' 2019 draft class ranks roughly average at 18th in Value Rate and 25th in Value vs. Expectation rate.
| Rk | Team | Value Rate | Value Rate+ | GM | RK | Avg. Value Vs. Expected |
|---|---|---|---|---|---|---|
| 1 | OAK | 5.35% | 171.25 | Mike Mayock | 8 | 0.06% |
| 2 | NYG | 4.87% | 155.91 | Dave Gettleman | 12 | 0.04% |
| 3 | TB | 4.79% | 153.35 | Jason Licht | 1 | 0.16% |
| 4 | WFT | 4.63% | 148.24 | Bruce Allen | 5 | 0.09% |
| 5 | ARI | 4.55% | 145.69 | Steve Keim | 18 | -0.02% |
| 6 | TEN | 4.47% | 143.13 | Jon Robinson | 4 | 0.14% |
| 7 | BUF | 4.15% | 132.91 | Brandon Beane | 11 | 0.05% |
| 8 | SF | 4.15% | 132.91 | John Lynch | 8 | 0.06% |
| 9 | MIN | 3.75% | 120.13 | Rick Spielman | 13 | 0.03% |
| 10 | GB | 3.59% | 115.02 | Brian Gutekunst | 19 | -0.03% |
| 11 | JAX | 3.59% | 115.02 | Tom Coughlin | 13 | 0.03% |
| 12 | SEA | 3.43% | 109.90 | John Schneider | 23 | -0.05% |
| 13 | BAL | 3.12% | 99.68 | Eric DeCosta | 8 | 0.06% |
| 14 | DEN | 3.04% | 97.12 | John Elway | 19 | -0.03% |
| 15 | MIA | 3.04% | 97.12 | Chris Grier | 3 | 0.15% |
| 16 | ATL | 2.96% | 94.57 | Thomas Dimitroff | 17 | -0.01% |
| 17 | KC | 2.96% | 94.57 | Brett Veach | 1 | 0.16% |
| 18 | NE | 2.96% | 94.57 | Bill Belichick | 25 | -0.08% |
| 19 | PIT | 2.88% | 92.01 | Kevin Colbert | 22 | -0.04% |
| 20 | HOU | 2.80% | 89.46 | Brian Gaine | 19 | -0.03% |
| 21 | LAR | 2.80% | 89.46 | Les Snead | 13 | 0.03% |
| 22 | DET | 2.72% | 86.90 | Bob Quinn | 25 | -0.08% |
| 23 | IND | 2.56% | 81.79 | Chris Ballard | 27 | -0.09% |
| 24 | CIN | 2.40% | 76.68 | Mike Brown | 29 | -0.13% |
| 25 | CLE | 2.16% | 69.01 | John Dorsey | 16 | 0.00% |
| 26 | NYJ | 2.08% | 66.45 | Mike Maccagnan | 30 | -0.13% |
| 27 | LAC | 1.92% | 61.34 | Tom Telesco | 27 | -0.09% |
| 28 | CAR | 1.84% | 58.79 | Marty Hurney | 31 | -0.15% |
| 29 | NO | 1.84% | 58.79 | Mickey Loomis | 5 | 0.09% |
| 30 | DAL | 1.60% | 51.12 | Jerry Jones | 24 | -0.06% |
| 31 | CHI | 1.52% | 48.56 | Ryan Pace | 7 | 0.07% |
| 32 | PHI | 1.52% | 48.56 | Howie Roseman | 32 | -0.20% |
Here's a spreadsheet with metrics on every player drafted in 2019.
The Patriots also found wide receivers Jakobi Meyers and Gunner Olszewski, linebacker Terez Hall and defensive tackle Nick Thurman after the draft as rookie free agents. It's not really the point of the exercise but if you incorporate all undrafted free agents whose first season came in 2019, then the Patriots' 2019 rookie class hits an above-average threshold of a 3.43 Value Rate and a 109.6 Value Rate+.
Meyers, ironically, actually would have a positive Value Vs. Expected rate if taken where Harry was selected 32nd overall.
Discluding the Patriots' UDFAs, we'd give the New England's draft class a C+. Include the undrafted players, and it becomes a B.
The Patriots also traded 2019 draft picks for wide receiver Josh Gordon, defensive tackle Danny Shelton and cornerback Johnson Bademosi.
Without the context of every trade involving draft picks all 31 other NFL teams made, we'd prefer to judge draft classes in a vacuum based on value rate and value over expectation. The Patriots' ability to acquire veteran players is much less in doubt, a different skill and tougher to gauge in a value metric. But at the very least, we'll note the veteran players acquired via draft capital.
2018
The Patriots traded wide receiver Brandin Cooks (we'll get into how they acquired him next) to the Los Angeles Rams for the 23rd overall pick and selected offensive tackle Isaiah Wynn. They grabbed running back Sony Michel in the first round, cornerback Duke Dawson in the second round, linebacker Ja'Whaun Bentley in the fifth round, linebacker Christian Sam and wide receiver Braxton Berrios in the sixth round and quarterback Danny Etling, cornerback Keion Crossen and tight end Ryan Izzo in the seventh round.
| Player | Value Rate | Value Rate+ | Value Vs. Expected |
|---|---|---|---|
| Isaiah Wynn | 0.38% | 97.06 | -0.50% |
| Sony Michel | 0.71% | 181.99 | -0.07% |
| Duke Dawson | 0.14% | 36.40 | -0.43% |
| Ja'Whaun Bentley | 0.62% | 157.73 | 0.36% |
| Christian Sam | 0.00% | 0.00 | -0.20% |
| Braxton Berrios | 0.19% | 48.53 | 0.05% |
| Danny Etling | 0.00% | 0.00 | -0.13% |
| Keion Crossen | 0.19% | 48.53 | 0.10% |
| Ryan Izzo | 0.14% | 36.40 | 0.06% |
Michel and Bentley are the most valuable players New England selected in this year's class. This class perfectly illustrates the difference between Value Rate and Value Vs. Expected rate. The Patriots extracted more value out of the entire draft by taking Michel, but Izzo was a better value for where he was taken. Michel has been a good player, but the also hasn't been worth the 31st overall pick. Izzo has been an OK player who should have gone higher than pick 250.
Overall, this is a weaker class for the Patriots despite having two first-round picks, ranking 22nd in Value Rate and 26th in Value Vs. Expected rate.
| Rk | Team | Value Rate | Value Rate+ | GM | Rk | Avg. Value Vs. Expected |
|---|---|---|---|---|---|---|
| 1 | BAL | 7.73% | 247.20 | Ozzie Newsome | 1 | 0.30% |
| 2 | IND | 7.30% | 233.55 | Chris Ballard | 2 | 0.21% |
| 3 | CLE | 4.88% | 156.21 | John Dorsey | 28 | -0.11% |
| 4 | BUF | 4.74% | 151.66 | Brandon Beane | 3 | 0.16% |
| 5 | SF | 4.31% | 138.01 | John Lynch | 6 | 0.08% |
| 6 | MIA | 4.17% | 133.46 | Chris Grier | 5 | 0.12% |
| 7 | TB | 3.65% | 116.78 | Jason Licht | 20 | -0.04% |
| 8 | CHI | 3.60% | 115.26 | Ryan Pace | 8 | 0.04% |
| 9 | DEN | 3.51% | 112.23 | John Elway | 22 | -0.06% |
| 10 | CIN | 3.32% | 106.16 | Mike Brown | 16 | -0.03% |
| 11 | ATL | 3.27% | 104.64 | Thomas Dimitroff | 4 | 0.14% |
| 12 | DAL | 3.18% | 101.61 | Jerry Jones | 10 | 0.00% |
| 13 | OAK | 3.13% | 100.09 | Reggie McKenzie | 21 | -0.05% |
| 14 | NYG | 2.94% | 94.03 | Dave Gettleman | 29 | -0.13% |
| 15 | GB | 2.80% | 89.48 | Brian Gutekunst | 22 | -0.06% |
| 16 | CAR | 2.75% | 87.96 | Marty Hurney | 16 | -0.03% |
| 17 | LAC | 2.70% | 86.45 | Tom Telesco | 15 | -0.02% |
| 18 | DET | 2.65% | 84.93 | Bob Quinn | 11 | -0.01% |
| 19 | SEA | 2.61% | 83.41 | John Schneider | 16 | -0.03% |
| 20 | JAX | 2.51% | 80.38 | Tom Coughlin | 9 | 0.02% |
| 21 | MIN | 2.46% | 78.86 | Rick Spielman | 11 | -0.01% |
| 22 | WFT | 2.37% | 75.83 | Bruce Allen | 24 | -0.07% |
| 22 | NE | 2.37% | 75.83 | Bill Belichick | 26 | -0.08% |
| 24 | PIT | 2.32% | 74.31 | Kevin Colbert | 24 | -0.07% |
| 25 | LAR | 2.23% | 71.28 | Les Snead | 11 | -0.01% |
| 26 | HOU | 2.09% | 66.73 | Brian Gaine | 16 | -0.03% |
| 26 | ARI | 2.09% | 66.73 | Steve Keim | 27 | -0.09% |
| 28 | TEN | 1.94% | 62.18 | Jon Robinson | 11 | -0.01% |
| 29 | NYJ | 1.85% | 59.15 | Mike Maccagnan | 29 | -0.13% |
| 30 | PHI | 1.75% | 56.11 | Howie Roseman | 7 | 0.06% |
| 31 | NO | 1.47% | 47.01 | Mickey Loomis | 29 | -0.13% |
| 32 | KC | 1.33% | 42.46 | Brett Veach | 32 | -0.14% |
Here's a spreadsheet with metrics on every player drafted in 2018.
The Patriots signed cornerback JC Jackson as an undrafted free agent. Including Jackson, and all of the value generated from 2019 UDFAs, only bumps the Patriots' Value Rate up to 2.42 for a 77.3 Value Rate+.
This draft class gets a C- so far. Wynn has a chance to improve it if he can stay healthy and continue to serve as the Patriots' left tackle.
The Patriots also traded 2018 picks for offensive tackle Trent Brown, wide receiver Cordarrelle Patterson, cornerback Jason McCourty, defensive end Cassius Marsh, linebacker Marquis Flowers and cornerback Eric Rowe. They traded quarterback Jimmy Garoppolo for a second-round pick. The Patriots come out favorable in their veteran trades.
2017
This is the most difficult Patriots draft class to grade because there are so many variables in play. On its surface, this is one of the absolute worst draft classes of the last 21 years, ranking 659th out of 671 classes in Value Rate.
That's ... pretty awful.
The Patriots traded their first-round pick and a third-round pick to the New Orleans Saints for one year of Cooks and a fourth-round pick, however. They traded their second-round pick for defensive end Kony Ealy and an early third-round pick. They also traded linebacker Jamie Collins for a third-round pick.
The Patriots traded down to take defensive end Derek Rivers in the third round and back up to take offensive tackle Antonio Garcia.
They traded a fourth-round pick for tight end Dwayne Allen and a sixth-round pick. They traded a fifth-round pick for tight end James O'Shaughnessy and a sixth-round pick. They had previously traded a fifth-round pick for linebacker Barkevious Mingo, a sixth-round pick for linebacker Kyle Van Noy and a seventh-round pick (one of the best trades in NFL history), and acquired a fifth-round pick for tight end A.J. Derby.
The Patriots grabbed defensive end Deatrich Wise in the fourth round and offensive tackle Conor McDermott in the sixth round.
| Player | Value Rate | Value Rate+ | Value Vs. Expected |
|---|---|---|---|
| Derek Rivers | 0.08% | 19.33 | -0.37% |
| Antonio Garcia | 0.00% | 0.00 | -0.44% |
| Deatrich Wise Jr. | 0.65% | 164.29 | 0.37% |
| Conor McDermott | 0.08% | 19.33 | -0.07% |
Wise was a nice find. Rivers, Garcia and McDermott were decidedly not.
| Rk | Team | Value Rate | Value Rate+ | GM | Rk | Avg. Value Vs. Expected |
|---|---|---|---|---|---|---|
| 1 | NO | 7.03% | 224.90 | Mickey Loomis | 1 | 0.43% |
| 2 | LAC | 4.62% | 147.90 | Tom Telesco | 4 | 0.20% |
| 3 | BUF | 4.28% | 136.90 | Doug Whaley | 2 | 0.26% |
| 4 | HOU | 4.20% | 134.45 | Rick Smith | 5 | 0.19% |
| 5 | CLE | 4.09% | 130.79 | Sashi Brown | 27 | -0.12% |
| 6 | CAR | 4.05% | 129.56 | Dave Gettleman | 9 | 0.10% |
| 7 | KC | 4.01% | 128.34 | John Dorsey | 3 | 0.23% |
| 7 | PIT | 4.01% | 128.34 | Kevin Colbert | 6 | 0.15% |
| 7 | MIN | 4.01% | 128.34 | Rick Spielman | 9 | 0.10% |
| 10 | SF | 3.71% | 118.56 | John Lynch | 17 | -0.04% |
| 11 | LAR | 3.59% | 114.90 | Les Snead | 8 | 0.12% |
| 12 | IND | 3.55% | 113.67 | Chris Ballard | 11 | 0.07% |
| 12 | SEA | 3.55% | 113.67 | John Schneider | 13 | -0.01% |
| 14 | CHI | 3.51% | 112.45 | Ryan Pace | 7 | 0.14% |
| 15 | GB | 3.36% | 107.56 | Ted Thompson | 12 | 0.02% |
| 16 | WFT | 3.28% | 105.12 | Bruce Allen | 13 | -0.01% |
| 17 | TEN | 3.09% | 99.01 | Jon Robinson | 19 | -0.07% |
| 18 | CIN | 2.94% | 94.12 | Mike Brown | 21 | -0.09% |
| 19 | JAX | 2.79% | 89.23 | Tom Coughlin | 19 | -0.07% |
| 20 | DET | 2.75% | 88.01 | Bob Quinn | 15 | -0.03% |
| 21 | BAL | 2.67% | 85.56 | Ozzie Newsome | 21 | -0.09% |
| 22 | NYJ | 2.48% | 79.45 | Mike Maccagnan | 25 | -0.11% |
| 23 | NYG | 2.33% | 74.56 | Jerry Reese | 15 | -0.03% |
| 24 | ARI | 2.29% | 73.34 | Steve Keim | 25 | -0.11% |
| 25 | DAL | 2.22% | 70.89 | Jerry Jones | 18 | -0.05% |
| 26 | PHI | 2.10% | 67.23 | Howie Roseman | 30 | -0.14% |
| 27 | MIA | 1.95% | 62.34 | Chris Grier | 21 | -0.09% |
| 27 | TB | 1.95% | 62.34 | Jason Licht | 27 | -0.12% |
| 29 | DEN | 1.83% | 58.67 | John Elway | 31 | -0.15% |
| 30 | ATL | 1.72% | 55.00 | Thomas Dimitroff | 24 | -0.10% |
| 31 | OAK | 1.22% | 39.11 | Reggie McKenzie | 32 | -0.17% |
| 32 | NE | 0.80% | 25.67 | Bill Belichick | 29 | -0.13% |
Here's a spreadsheet with metrics on every player drafted in 2017.
The Patriots predictably rank dead last in Value Rate for that four-man draft class and only slightly better in value over expected rate. They also found defensive tackle Adam Butler as an undrafted free agent. As far as rookie acquisition goes, this class gets a D with Butler included and a D- without him. It's rough all around.
Throw in the one-year addition of Cooks, plus Allen and Van Noy's contributions, the wasted capital on Ealy, Mingo and O'Shaughnessy and giving away 2 1/2 seasons of Collins, and, overall, this draft looks better.
The Cooks trade was a good one. The Patriots essentially rented Cooks for free while trading a 2017 first-round pick for a 2018 first-round pick.
2016
The Patriots' latest above-average draft class came five years ago, and New England did it without the benefit of a first-round pick, which they lost as part of their punishment for Deflategate.
The Patriots traded defensive end Chandler Jones for a second-round pick that they then flipped to pick Joe Thuney and Malcolm Mitchell.
| Player | Value Rate | Value Rate+ | Value Vs. Expected |
|---|---|---|---|
| Cyrus Jones | 0.13% | 31.85 | -0.44% |
| Joe Thuney | 1.29% | 326.50 | 0.81% |
| Jacoby Brissett | 0.72% | 183.16 | 0.32% |
| Vincent Valentine | 0.09% | 23.89 | -0.30% |
| Malcolm Mitchell | 0.13% | 31.85 | -0.20% |
| Kamu Grugier-Hill | 0.41% | 103.53 | 0.27% |
| Elandon Roberts | 0.85% | 215.01 | 0.71% |
| Ted Karras | 0.60% | 151.31 | 0.47% |
| Devin Lucien | 0.00% | 0.00 | -0.12% |
The Mitchell pick ranks low, but he helped New England win a Super Bowl, which is obviously invaluable.
The Patriots hit on Thuney (big), Brissett, Grugier-Hill, Roberts and Karras. Brissett and Grugier-Hill wound up producing for other teams, however.
Still, this was the fourth-most valuable class of the 2016 NFL Draft by either metric.
| Rk | Team | Value Rate | Value Rate+ | GM | Rk | Avg. Value Vs. Expected |
|---|---|---|---|---|---|---|
| 1 | DAL | 6.11% | 195.40 | Jerry Jones | 1 | 0.26% |
| 2 | TEN | 5.07% | 162.17 | Jon Robinson | 11 | 0.05% |
| 3 | JAX | 4.44% | 142.02 | David Caldwell | 4 | 0.17% |
| 4 | NE | 4.22% | 134.97 | Bill Belichick | 4 | 0.17% |
| 6 | CHI | 4.12% | 131.95 | Ryan Pace | 11 | 0.05% |
| 5 | BAL | 4.12% | 131.95 | Ozzie Newsome | 18 | -0.03% |
| 7 | ATL | 4.09% | 130.94 | Thomas Dimitroff | 2 | 0.25% |
| 9 | KC | 4.06% | 129.93 | John Dorsey | 9 | 0.08% |
| 8 | CLE | 4.06% | 129.93 | Sashi Brown | 24 | -0.10% |
| 10 | GB | 3.93% | 125.90 | Ted Thompson | 6 | 0.16% |
| 11 | PHI | 3.81% | 121.88 | Howie Roseman | 7 | 0.14% |
| 14 | NO | 3.68% | 117.85 | Mickey Loomis | 3 | 0.21% |
| 13 | MIA | 3.68% | 117.85 | Chris Grier | 13 | 0.05% |
| 12 | DET | 3.68% | 117.85 | Bob Quinn | 14 | 0.03% |
| 15 | IND | 3.65% | 116.84 | Ryan Grigson | 9 | 0.08% |
| 16 | SEA | 3.62% | 115.83 | John Schneider | 14 | 0.03% |
| 17 | DEN | 3.43% | 109.79 | John Elway | 8 | 0.09% |
| 18 | NYJ | 2.80% | 89.64 | Mike Maccagnan | 17 | 0.01% |
| 19 | CIN | 2.77% | 88.64 | Mike Brown | 16 | 0.02% |
| 20 | SDG | 2.52% | 80.58 | Tom Telesco | 25 | -0.13% |
| 21 | SF | 2.52% | 80.58 | Trent Baalke | 25 | -0.13% |
| 22 | NYG | 2.49% | 79.57 | Jerry Reese | 23 | -0.09% |
| 23 | HOU | 2.39% | 76.55 | Rick Smith | 20 | -0.05% |
| 24 | LAR | 2.39% | 76.55 | Les Snead | 22 | -0.07% |
| 25 | PIT | 2.20% | 70.51 | Kevin Colbert | 19 | -0.04% |
| 26 | CAR | 1.86% | 59.43 | Dave Gettleman | 21 | -0.06% |
| 27 | OAK | 1.67% | 53.38 | Reggie McKenzie | 31 | -0.20% |
| 28 | WFT | 1.54% | 49.35 | Scot McCloughan | 27 | -0.15% |
| 29 | BUF | 1.51% | 48.35 | Doug Whaley | 29 | -0.19% |
| 30 | TB | 1.48% | 47.34 | Jason Licht | 32 | -0.25% |
| 31 | MIN | 1.16% | 37.27 | Rick Spielman | 28 | -0.18% |
| 32 | ARI | 0.91% | 29.21 | Steve Keim | 29 | -0.19% |
Here's a spreadsheet with metrics on every player drafted in 2016.
We'll give the Patriots an A- for this draft.
The Jones trade is an example of why we don't necessarily want to include trades for veteran players as part of our grades because there are so many variables involved. The Patriots traded Jones and wound up with Thuney.
Earlier, they traded for Cooks, missed out on Saints offensive tackle Ryan Ramczyk then flipped the wide receiver and wound up with Wynn. Most trades also wind up as short-term rentals, and veteran players cost considerably more money than rookies.
GENERAL MANAGERS
Now, let's take a look at where Belichick ranks among general managers in this timeframe.
| Rk | Years | Team | Value Rate | Value Rate+ | GM | Rk | Value Vs. Expected |
|---|---|---|---|---|---|---|---|
| 1 | 2016-2018 | BAL | 4.84% | 154.9 | Ozzie Newsome | 5 | 0.09% |
| 2 | 2020 | WFT | 4.76% | 152.38 | Ron Rivera | 1 | 0.21% |
| 3 | 2019-2020 | BAL | 4.37% | 139.64 | Eric DeCosta | 4 | 0.11% |
| 4 | 2017-2020 | IND | 4.33% | 138.55 | Chris Ballard | 6 | 0.08% |
| 5 | 2016-2017 | CLE | 4.08% | 130.36 | Sashi Brown | 42 | -0.11% |
| 6 | 2016, 2020 | JAX | 4.01% | 128.16 | David Caldwell | 26 | -0.02% |
| 7 | 2018-2020 | BUF | 3.87% | 123.88 | Brandon Beane | 2 | 0.13% |
| 8 | 2016-2020 | MIA | 3.79% | 121.28 | Chris Grier | 11 | 0.05% |
| 9 | 2016-2019 | KC, CLE | 3.78% | 120.87 | John Dorsey | 13 | 0.04% |
| 10 | 2017-2020 | SF | 3.68% | 117.78 | John Lynch | 16 | 0.03% |
| 11 | 2016 | IND | 3.65% | 116.84 | Ryan Grigson | 6 | 0.08% |
| 11 | 2016-2017 | GB | 3.65% | 116.73 | Ted Thompson | 6 | 0.08% |
| 13 | 2019-2020 | RAI | 3.61% | 115.56 | Mike Mayock | 39 | -0.09% |
| 14 | 2016-2020 | CAR/NYG | 3.49% | 111.73 | Dave Gettleman | 21 | 0.01% |
| 15 | 2017-2019 | WFT | 3.43% | 109.73 | Bruce Allen | 21 | 0.01% |
| 16 | 2016-2020 | MIN | 3.40% | 108.8 | Rick Spielman | 18 | 0.02% |
| 17 | 2016-2017 | HOU | 3.30% | 105.5 | Rick Smith | 6 | 0.08% |
| 18 | 2016-2020 | DAL | 3.27% | 104.48 | Jerry Jones | 13 | 0.04% |
| 19 | 2016-2020 | LAC | 3.24% | 103.68 | Tom Telesco | 16 | 0.03% |
| 20 | 2016-2020 | SEA | 3.22% | 103.04 | John Schneider | 26 | -0.02% |
| 21 | 2016-2020 | DEN | 3.14% | 100.48 | John Elway | 32 | -0.03% |
| 22 | 2016-2020 | TB | 3.12% | 99.84 | Jason Licht | 26 | -0.02% |
| 23 | 2016-2020 | NO | 3.11% | 99.52 | Mickey Loomis | 3 | 0.12% |
| 23 | 2016-2020 | DET | 3.11% | 99.52 | Bob Quinn | 26 | -0.02% |
| 25 | 2016-2020 | TEN | 3.05% | 97.6 | Jon Robinson | 26 | -0.02% |
| 26 | 2016-2020 | CHI | 3.03% | 96.96 | Ryan Pace | 10 | 0.06% |
| 26 | 2016-2020 | CIN | 3.03% | 96.96 | Mike Brown | 36 | -0.06% |
| 28 | 2018-2020 | CAR | 3.00% | 96.08 | Marty Hurney | 24 | -0.01% |
| 29 | 2017-2019 | JAX | 2.96% | 94.88 | Tom Coughlin | 24 | -0.01% |
| 30 | 2016-2017 | BUF | 2.90% | 92.63 | Doug Whaley | 18 | 0.02% |
| 31 | 2020 | CLE | 2.89% | 92.52 | Andrew Berry | 35 | -0.04% |
| 31 | 2020 | NYJ | 2.89% | 92.52 | Joe Douglas | 45 | -0.15% |
| 33 | 2016-2020 | ATL | 2.85% | 91.2 | Thomas Dimitroff | 13 | 0.04% |
| 34 | 2016-2020 | PIT | 2.79% | 89.36 | Kevin Colbert | 18 | 0.02% |
| 35 | 2016-2020 | NE | 2.65% | 84.8 | Bill Belichick | 26 | -0.02% |
| 36 | 2016-2020 | RAM | 2.61% | 83.52 | Les Snead | 23 | 0.00% |
| 37 | 2018-2020 | GB | 2.58% | 82.68 | Brian Gutekunst | 38 | -0.08% |
| 38 | 2016 | SF | 2.52% | 80.58 | Trent Baalke | 43 | -0.13% |
| 39 | 2018-2020 | KC | 2.45% | 78.33 | Brett Veach | 11 | 0.05% |
| 39 | 2018-2019 | HOU | 2.45% | 78.1 | Brian Gaine | 32 | -0.03% |
| 41 | 2016-2020 | PHI | 2.41% | 77.12 | Howie Roseman | 32 | -0.03% |
| 41 | 2016-2017 | NYG | 2.41% | 77.07 | Jerry Reese | 36 | -0.06% |
| 43 | 2016-2019 | NYJ | 2.30% | 73.67 | Mike Maccagnan | 39 | -0.09% |
| 44 | 2016-2020 | ARI | 2.24% | 71.68 | Steve Keim | 41 | -0.10% |
| 45 | 2016-2018 | RAI | 2.01% | 64.19 | Reggie McKenzie | 44 | -0.14% |
| 46 | 2016 | WFT | 1.54% | 49.35 | Scot McCloughan | 45 | -0.15% |
| 47 | 2020 | HOU | 0.68% | 21.77 | Bill O'Brien | 47 | -0.23% |
Ultimately, five years is a small sample size, but Belichick doesn't rank particularly well compared to his contemporaries.
We'll give a spoiler away for the next part of this series: Belichick ranks much higher looking ten years into the past with the 2011, 2012, 2013 and 2015 included. And that's not even including impressive draft classes in 2009 and 2010.
Belichick has hit on drafts in the recent past. But the last five years have not been particularly kind to the Patriots.
